Read an array of aero_dists with associated times and rates from the given file.
- Parameters
-
[in,out] file Spec file to read data from. [in,out] aero_data Aero data. times Times (s). rates Rates (s^{-1}). aero_dists Aero dists.
An aerosol distribution profile input file must consist of three lines:
- the first line must begin with
timeand should be followed by space-separated real scalars, giving the times (in s after the start of the simulation) of the aerosol distrbution set points — the times must be in increasing order
 - the second line must begin with
rateand should be followed by space-separated real scalars, giving the values at the corresponding times - the third line must begin with
distand should be followed by space-separated filenames, each specifying an aerosol distribution in the format Input File Format: Aerosol Distribution at the corresponding time
The units of the rate line depend on the type of aerosol distribution profile:
- Emissions aerosol profiles have rates with units m/s — the aerosol distribution number concentrations are multiplied by the rate to give an emission rate with unit #/(m^2 s) which is then divided by the current mixing layer height to give a per-volume emission rate.
- Background aerosol profiles have rates with units
 , which is the dilution rate between the background and the simulated air parcel. That is, if the simulated number concentration is and the background number concentration is
  , then dilution is modeled as
 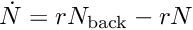 , where
  is the rate.
Between the specified times the aerosol profile is interpolated step-wise and kept constant at its last value. That is, if the times are  , the rates are
  , and the aerosol distributions are
  (all with
  ), then between times and
  the aerosol state is constant at
  . Before time
  the aerosol state is
  , while after time
  it is
it is  .
.
Example: an emissions aerosol profile could be:
 time  0          600        1800       # time (in s) after sim start
 rate  1          0.5        1          # scaling factor in m/s
 dist  dist1.dat  dist2.dat  dist3.dat  # aerosol distribution files
Here the emissions between 0 min and 10 min are given by dist1.dat (with the number concentration interpreted as having units 1/(m^2 s)), the emissions between 10 min and 30 min are given by dist2.dat (scaled by 0.5), while the emissions after 30 min are given by dist3.dat.
See also:
- Input File Format: Spec File Format — the input file text format
- Input File Format: Aerosol Material Data — the aerosol species list and material data
- Input File Format: Aerosol Distribution — the format of the instantaneous aerosol distribution files